Visualising RabbitMQ Topologies
This post first appeared on the LShift web site.
I’m currently documenting an application that uses RabbitMQ extensively. I want to show the routing topology within the broker, but I want the bulk generated automatically because there are a lot of entities to deal with. Given that I can export the broker definitions into JSON, it seemed like it would be fairly straightforward to generate something using Graphviz.
Inspired by the diagrams in the RabbitMQ Getting Started tutorial (which handily include the dot source files), I came up with this small script.
I’ve made the generation of the consumer and producer nodes optional because they are arbitrarily mapped (assume one producer per exchange, one consumer per queue), but it was a useful starting point to have them for my work.
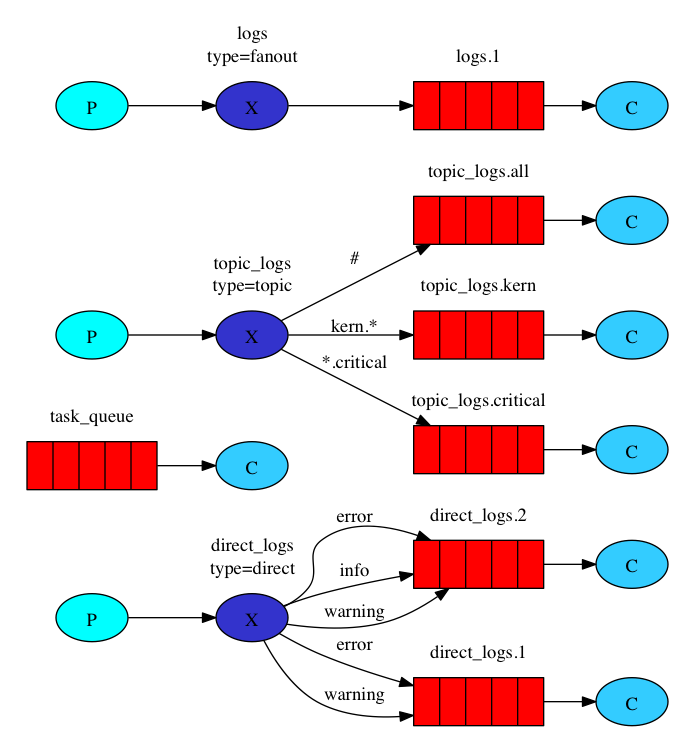
The output from a broker which has some of the tutorial definitions in it looks like this: